- Project Motivation
- Project Objective
- Literature Review
- Methodology
- Application Design Storyboard
- Application System Architecture
- Data
- Challenges and Mitigation
- Scope of Work
- Task Completion List
Project Motivation
Children are the future of a nation’s well-being. There is therefore an incentive for the nation to ensure the healthy development of a child into adulthood.
There have been studies on how built spaces affect the development of children. Based on recurring key factors identified across these studies, geospatial analysis of Singapore’s neighborhoods can be conducted, to map and understand geospatial gaps, pinpointing risk areas that might require intervention.
This is especially relevant for public housing, that is sometimes at a disadvantage compared to private housing where developers are already incentivized or expected to provide some of these built environment factors (e.g. green spaces, recreation spaces). As such, risk areas for childhood development in public housing will be the focus area for this project.
Project Objective
This project aims to:
Investigate the spatial distribution of key factors of the built environment affecting child development, relative to public housing estates in Singapore.
Identify high risk neighbourhoods for healthy child development, based on built environment factors.
Provide possible recommendations to mitigate these risks.
Utilise open source data to build a proof-of-concept web-based geospatial application.
Literature Review
Literature reviews were conducted for a more evidence-based project. This will better enable the analysis and development of a web-based geospatial analytics application to identify at-risk neighbourhoods for healthy child development.
Reviewing Research on Relationship Between Built Environment and Child Development
To understand the current state-of-the-art in terms of the built environment and its relationship to child development, we identified key literatures that draw from existing research knowledge, and which have conducted real world experiments to identify these relationships. Through the literature reviews, we aim to identify overarching domains for healthy child development and their corresponding built environment factors, for utilisation in our project analysis.
Literature Review 1: Relationship Between the Neighbourhood Built Environment and Early Child Development
Aim
The researchers utilised area level data from the Australian Early Development Census (AEDC) that spatially maps the locations of children who are developmentally vulnerable, to identify if there are statistically significant relationships to the built environment.
Methods
To achieve the research aim, AEDC data was utilised to identify 3 child development domains:
Physical Health and Wellbeing: Whether children are healthy, independent, and physically ready for the school day, and their gross and fine motor skills.
Social Competence: Children’s overall social development including how they play, share and get along with other children.
Emotional Maturity: Whether children are able to concentrate during the school day, help others, are patient and not aggressive or angry.
In the AEDC data, children can be developmentally vulnerable in none, any and all of these domains. The researchers then utilised Geographical Information Systems to develop area level measures of the various Australian local communities, such as walkability, availability of green spaces, and availability of child specific destinations. They then utilised logistic regression to model variations in the communities and the odds of development vulnerability.
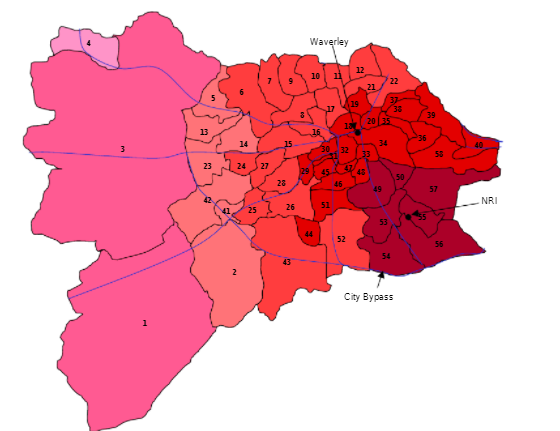
The choropleth maps below illustrate the spatial variation in the odds of children being developmentally vulnerable in the different child development domains.

Research Findings
The researchers were able to statistically identify the existence of relationships between the built environment and child development. Additionally, they identified certain factors such as:
Children living near a big yard and green spaces had the lowest odds of poor emotional development.
Neighborhoods with less traffic result in children with lower odds of poor social development.
Physical health improved the further away a school, childcare or park is located (which could be attributed to the exercise received by children who walk to these locations).
Key Takeaways
The research provides useful child development domain definitions and possible factors (such as walkability, green spaces and child-specific destinations) that can be utilised as a reference in the creation of risk matrices. This is an especially useful reference in Singapore’s context, where there is currently no publicly available child development domain definitions and child development statistics, and a lack of research on built environment factors for child development. The definitions and built factors pointed out by this research will therefore enable us to better derive risk scores for Singapore’s public housing neighbourhoods.
Literature Review 2: Levels of Influence in the Built Environment on the Promotion of Healthy Child Development
Aim
The author discusses the effects of the built environment on healthy child development, which is a departure from traditional research which focuses on the relationship of the built environment with child diseases and exposure to hazards and risks.
Methods
To study the impact of the built environment on healthy child development, the author first established key elements of child development, so that the relative influence of specific built environment factors can be investigated for each element. With reference to other research studies, the author defined the key elements of child development as:
Social knowledge and competence: Awareness of general standards of acceptable behaviour in a public place, the ability to control one’s own behaviour and cooperate with others in working together on assignments, appropriate respect for adult authority, and the skills to communicate feelings and wants in socially acceptable ways.
Emotional development and maturity: Self-confidence to try new tasks and not fear failure.
Language and cognitive development: Ability to understand and communicate with others, as well as to perceive, organize, and analyze the masses of information provided by the social and physical environments.
Healthy physical development: Includes physical readiness for activities of daily life, physical independence, motor skills and general vitality and resistance to illnesses.
Communication skills and general knowledge: Ability to clearly communicate one’s own needs and to understand others, active participation in story-telling and interest in general knowledge about the world.
To understand the extent of impact of the built neighbourhoods on healthy child development the author then turns to empirical research from other studies. In particular, Oliver, et al. (2007) uses multi-level modelling, a statistical technique that can separate out the proportion of total variance in the outcome that can be attributed to the neighbourhood level, and the proportion of variance that can be attributed to the household level.
Findings
The studies suggest that child development aspects such as physical health and well-being, language and cognitive development and communication skills and general knowledge are more strongly influenced at the neighbourhood level.
Key Takeaways
The study provides positive evidence that the built environment can be altered to enhance several aspects of healthy child development.
Infrastructure that encourages physical activity can enhance physical well-being of children.
Community recreation facilities and early learning programs that encourages cognitive, language and communication skills can significantly increase the external stimuli for children to develop lifelong skills.
The study therefore provides useful childhood development domain definitions that can be utilised in this project, in union with those identified from the previous literature review. It also provides evidence of a relationship between the built environment and various aspects of child development, which can be utilised in this project to identify Singapore-specific built factors (e.g. playgrounds, community centres) that can influence child development.
Reviewing Research on Accessibility Analysis
Based on current research, the relationship between the built environment and child development is often in relation to how accessible a certain built factor is to a child (such as accessibility to playgrounds and green spaces). As such, it will be useful to conduct literature review on current state-of-the-art methods for accessibility analysis, and how they are being utilised.
Literature Review 1: Accessibility analysis (Concepts and their application to transport policy, programme and project evaluation)
Aim
The researcher aims to encourage the usage of accessibility analysis in policy formulation, through defining and educating current available accessibility analysis methods and providing a real-world case study on its usage.
Methods
To achieve this aim, the researcher first identifies that most accessibility analysis measures can be grouped under three general but similar indicators. These are:
- Simple Indicators
Representation of transport and/or opportunity within the accessibility equation is simplified into thresholds. Time and distance thresholds adopted within these measures will depend upon the policy issue that is analysed. It can be applied to either the opportunities (e.g. shopping centres with more than 5,000 squared metres floor space) or the deterrence functions (e.g. jobs within 60 minutes travel time), or both.
Under this indicator, the accessibility measure for a specified location i is calculated as the sum of the opportunities available at alternative locations j within the defined threshold. The notation for this indicator is as follows:
\[A_i = \sum{O_j\delta_{ij}}\]
Where \(\delta = 1\) if the opportunity is within the generalised time or cost threshold, and \(\delta = 0\) otherwise.
Example calculations/indices under this indicator are:
- Catchment/contour indices: Count or number of people, jobs, or shops etc. within a threshold travel cost or buffer (distance or time) from a defined location
- Walking access time to public transport
- Time space geographic measures: Total Opportunities available within a travel time budget
- Opportunity Measures
Such indicators assess accessibility by utilising a measure of deterrence (based on how easily an opportunity can be reached) as a weight for the sum of all opportunities. Therefore, the opportunity measure for a location i is calculated by the sum of opportunities at j factored by the deterrence function, which is based on the travel time between i and j.
\[A_i=\ \sum O_j\ exp(-\alpha t_{ij})\]
Where \(exp(-\alpha t_{ij})\) is the deterrence function, and \(O_j\) is the opportunity available within zone j. The deterrence function is calibrated utilising the \(\alpha\) factor. This deterrence function will usually be calibrated based on observed local travel patterns, so as to provide accurate trip distributions.
Example calculations/indices under this indicator are:
- Hansen Indices
- Shimbel Measures
- Value Measures
The value measure aims to define the attractiveness of available opportunities, to represent their values as a transport choice. It utilises the same input data as the opportunity measure, but the equation is further transformed so that it is represented in terms of the value of generalized opportunities in time or cost. An example equation is as follows:
\[A_i=\ \frac{1}{\alpha}ln\frac{\sum O_j\ exp(-\alpha t_{ij})}{\sum O_j\ }\]
Example calculations/indices under this indicator are:
- Utility based measures: These measure the value to an individual or group of the choices available to them. The indices are less sensitive to large changes in the number of opportunities, and are relatively more sensitive to transport changes.
Research Findings
Based on these indicators identified, the researcher further presented a case study on a Scottish research, which utilised the accessibility measures to analyse the accessibility from different parts of Edinburgh to the new Royal Infirmary (that was under construction at the point of study). The choropleth map visualisation below was constructed, where the darker shades represent areas with good accessibility. Through this, alternative transport strategies (such as the introduction of new bus services) can be tested and evaluated on their effectiveness.
Key Takeaways
The researcher provides a compelling argument on the usage of accessibility analysis in the process of policy planning. He provides the figure below as an example of how the policy planning process can enable planners to study the impacts to more user groups without affecting the complexity of the demand modelling.

This is especially due to deterrence functions in accessibility measures that allow for localised calibrations, and as such provide a more evidence-based resolution to policy planning.
Through this project, we aim to also affect changes in policy planning through an evidence-based approach. As such, it will indeed be useful to utilise accessibility analysis in this project. It will especially be useful when assessing the child developmental risk scores of Singapore’s neighbourhoods.
Literature Review 2: How Accessibility Shapes Land Use
Aim
The author illustrates how a realistic measurement of accessibility, coupled with the availability of vacant developable land, can be used to develop a residential land use model. The land use model relates the accessibility (to commercial, industrial, and residential locations) of an area to the rate and intensity of residential land development in the area.
Methods
The author first presents an operational definition of accessibility, where accessibility is defined as the potential of opportunities for interaction. In contrast to traditional measures of accessibility that takes into account only the ease of interaction, this definition measures the intensity of the possibility of interaction. The measure considers the spatial distribution of activities about a point, adjusted for the ability and the desire of people to overcome spatial separation. The accessibility at point 1 to a particular type of activity at area 2 (such as employment), is directly proportional to the size of the activity at area 2 (e.g. number of jobs), and inversely proportional to some function of the distance separating point 1 from area 2. Total accessibility at point 1 is then the summation of accessibility to each of the individual areas around point 1.
\[A_1 = \frac{S_2}{T^X_{1-2}}\]
Where
- \(A_1\) is a relative measure of the accessibility at Zone 1 to an activity located within Zone 2
- \(S_2\) is the size of the activity in Zone 2 (e.g. number of jobs, people)
- \(T_{1-2}\) is the travel time or distance between Zones 1 and 2
- \(X\) is an exponent describing the effect of the travel time between the zones (the lower the exponent, the more important the trip)
The following data was then used for accessibility calculations in the study.
| Accessibility to | Units used for activity level or size | Exponent of distance* |
|---|---|---|
| Employment | Number of jobs | 2.20 |
| Shopping opportunities | Annual retail sales | 3.00 |
| Residential activity | Population | 2.35 |
*Distance was expressed in terms of minutes of off-peak driving time, plus 5 to 8 minutes of terminal time (to account for the variation between intra- and inter-urban travel).
Next was to determine the relationship between accessibility and residential development. The author accounted for zonal variation in land available for residential development by distributing total metropolitan growth to the individual zones on the basis of vacant developable land (the proportion assigned to each zone is termed probable development).
Residential development ratio was then calculated for each area (actual development divided by probable development), where its variance is assumed to be related to accessibility. With high correlation between the development ratio and the accessibility measures, the following relationship was established.
\[D_1 = KA^X_1\]
Where
- \(D_1\) is the development ratio for Zone 1
- \(A_1\) is the accessibility (e.g. to employment) at Zone 1
- \(K\) is a constant of proportionality
- \(X\) is the exponent describing the effect of the travel time between the zones
The relationship constructed above made it possible for to estimate the residential growth in any zone, if the accessibility (e.g. to employment) and the amount of developable land of the zone are known. This method was then used to estimate the residential growth in the Washington metropolitan area from 1948 to 1955 for each zone.
Research Findings
The calculations demonstrate the potential value of the land use model to city and transportation planners. The land use model can assist the planner in assessing the probable effects of a given action, such as the construction of an express highway or a policy of decentralizing employment.
This determination of consequences need not be limited to some predetermined area of “influence,” but can easily be assessed for the entire metropolitan region. It is also possible to isolate and examine empirically the effect of other factors on land development, such as income, zoning, taxes, and land costs.
Key Takeaways
This study provides a useful measure of accessibility that can potentially be used in this project. Traditional methods measure accessibility solely based on the travel time. While travelling time may be a good indicator, it does not account for other factors that may also influence the choice of journey.
The Hansen gravity model (1959) illustrated in this study addresses this problem, by accounting for various factors on top of travelling time, to measure accessibility by taking into account journey time as well as the attractiveness of destinations based on perceived opportunities. Using such accessibility measure will also enable us to map accessibility as a spatially continuous measurement.
Furthermore, the study reveals the suitability of using such an accessibility measure as a planning tool. The land use model illustrated in this study can possibly be utilised for scenario planning, as it enables the potential effects of a given action to be assessed.
Methodology
Based on the literature reviews conducted, the methodology to tackle this project’s research problem was formulated, to identify at-risk neighbourhoods in Singapore for healthy child development.
The project will take the following steps in its development:
Identify key domains for child development (physical health and well-being, social competence, emotional maturity) and their corresponding built environment factors, based on existing research
Data collection from various governmental data and open data
Data cleaning and wrangling
Formulate risk matrices based on built environment factors (e.g. proximity to green spaces)
Spatially map and analyse built factors and their spatial relation to public housing (e.g. point pattern analysis)
Utilise risk matrices to compute risk scores for each HDB new town (e.g. accessibility analysis)
Identify at-risk areas for healthy child development in relation to public housing (e.g. localised geospatial analysis)
Propose recommendations for improvement and highlight key findings
The methodology embarked on this project will be iterative, where previous steps will be revisited based on preliminary findings. This will allow the project to go deeper in understanding the spatial relationships and identify areas for improvement.
Application Design Storyboard
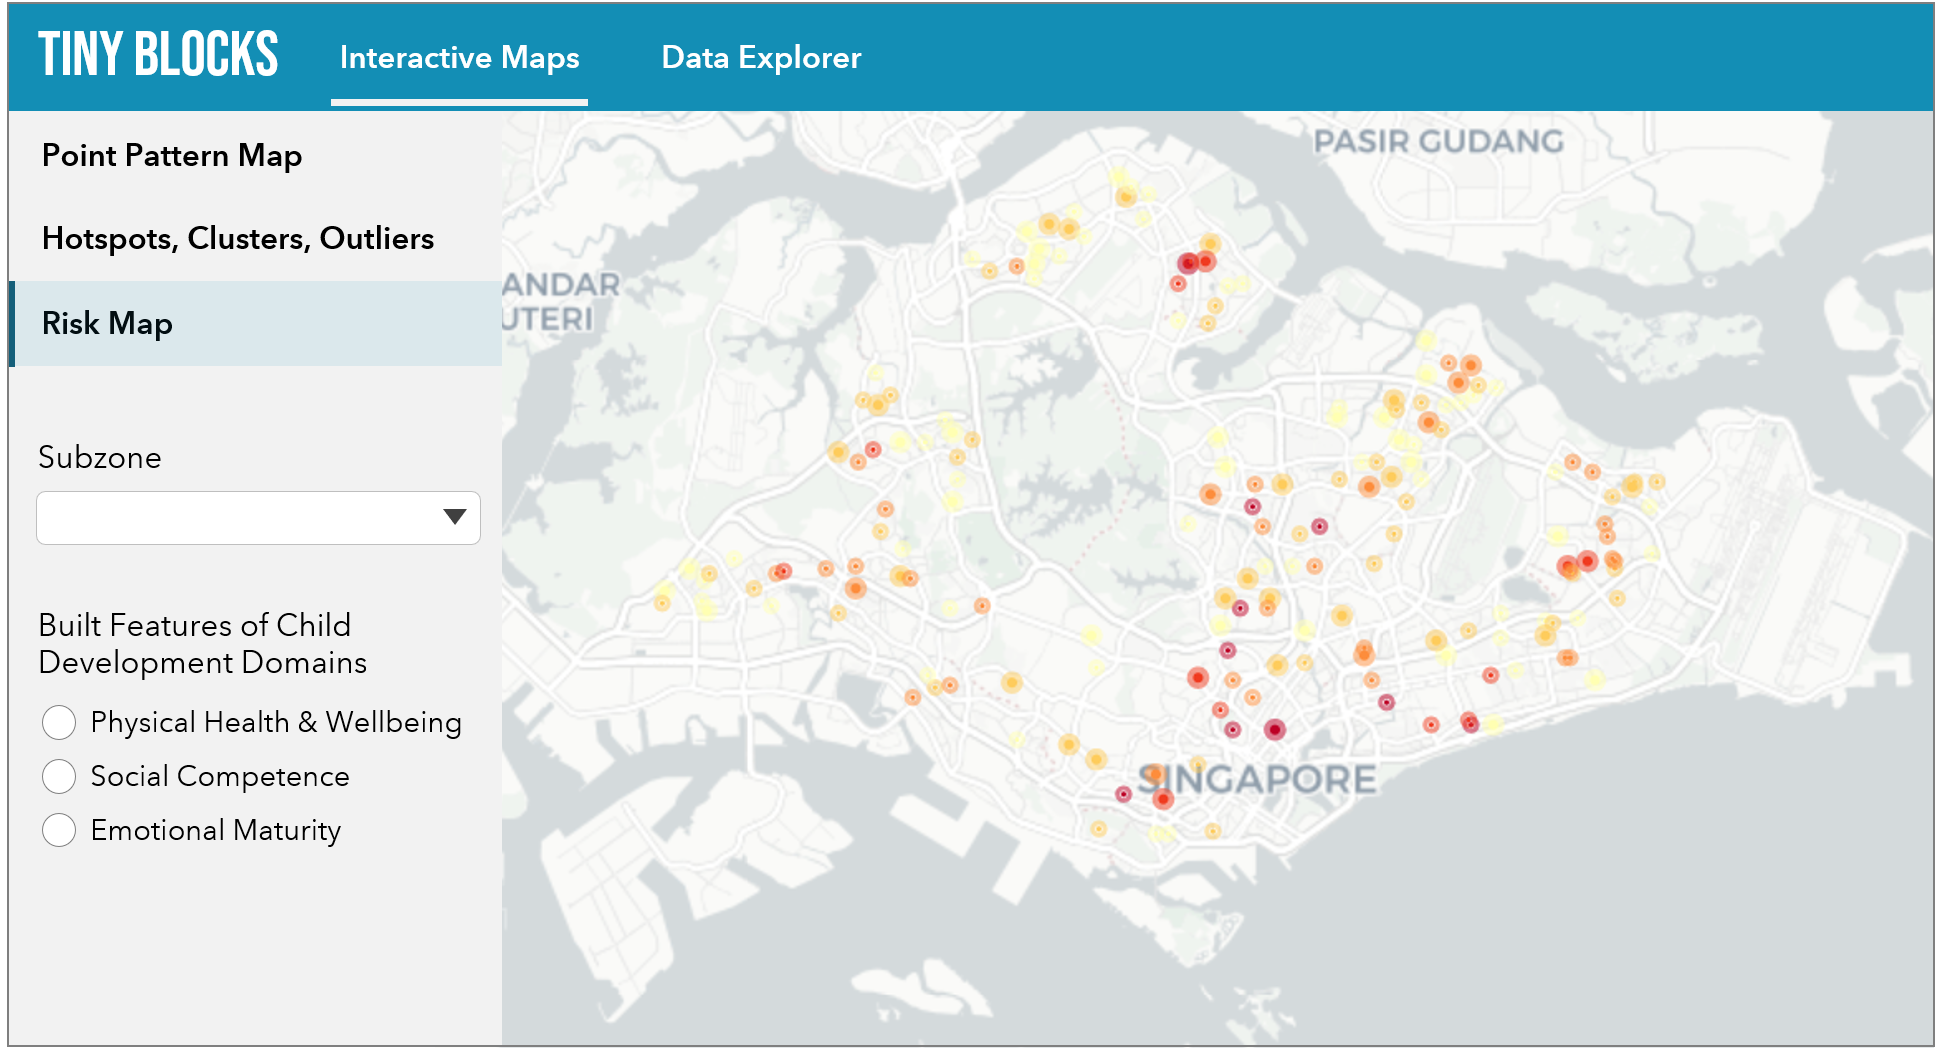
The storyboards below are envisioned to serve as a guide in the development of the application.
Interactive Maps
The interactive maps tab will allow users to view the various spatial analysis that have been conducted (such as point pattern analysis, localised geospatial analysis etc.). Users will be able to select the desired map, interact with it, and drill-down to specific neighbourhoods by selecting the specific subzones. They will also be able to select various built features (e.g. green spaces, schools, recreation spaces) to be displayed (overlay) based on its relation to the child development domains.
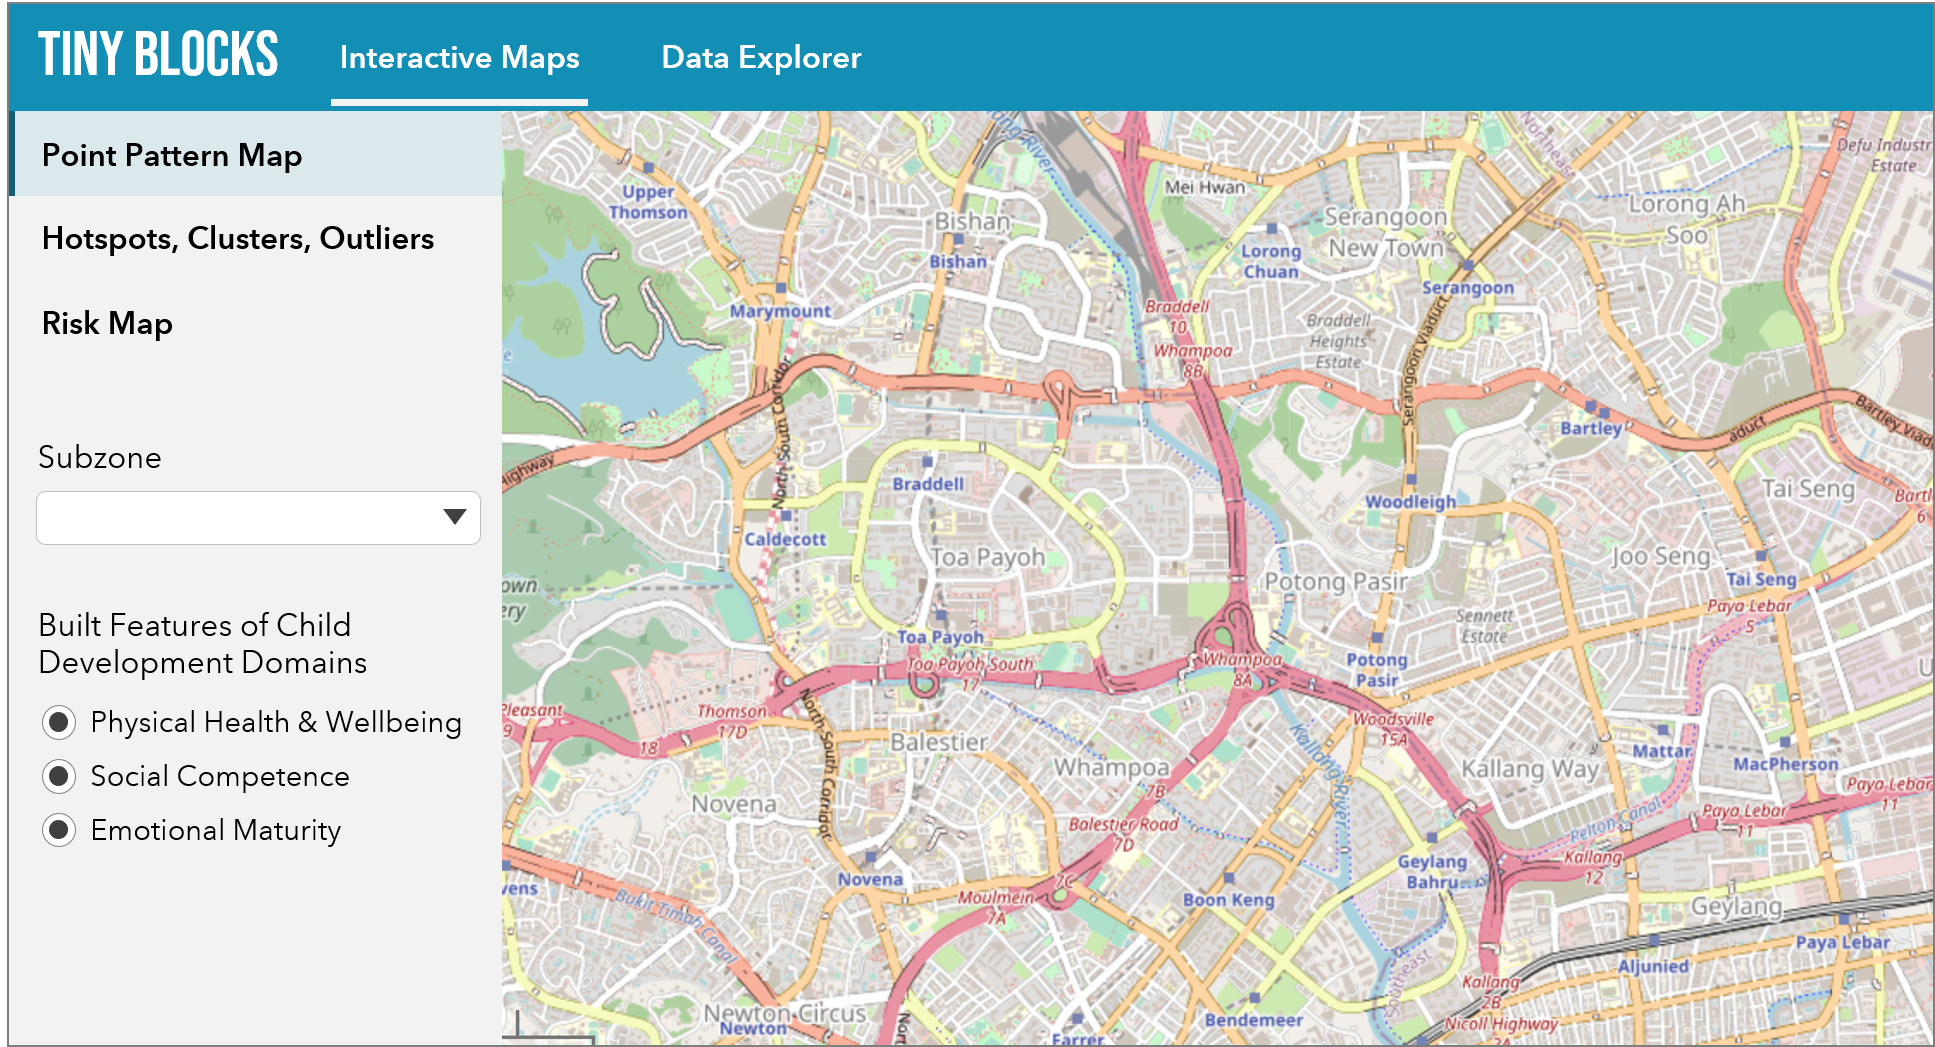
For the risk map, users will additionally be able to view the computed risk scores for each public housing estate and breakdown by subzone.

Data Explorer
The data explorer tab will allow users to explore the datasets that were utilised in the analysis in a tabular format. This will help users understand the underlying data that was used in the analysis and in this application.

Application System Architecture
This project will be developed with R, as it will enable us to utilise the geospatial analysis and data manipulation libraries, in union with R Shiny to create an integrated web-based geospatial analytics application. The R Shiny application runs on a Shiny server, hosted on shinyapps.io along with the data for the application. The data and maps will be loaded by the application and displayed to the user whenever they access the application.

Data
The following shows the datasets that are expected to be utilised in this project. They will be mostly retrieved from the Singapore government’s open data portal, data.gov.sg. Where relevant, other open source data will also be utilised in the analysis.
| Data | Description | Data Type |
|---|---|---|
| Master Plan 2014 Subzone Boundary | Indicative polygon of subzone boundary in Singapore, provided by Urban Redevelopment Authority (Source) | SHP |
| Population by Subzone and Type of Dwelling | Distribution of the resident population by planning area and subzone (Source) | CSV |
| OpenStreetMap (OSM) Singapore | OpenStreetMap extract for Singapore (Source) | SHP |
| School | List of schools in Singapore (Source) | CSV |
| Pre-School | Location of pre-schools (Source) | KML |
| Childcare Centre | Location of childcare services (Source) | KML |
| Student Care | Location of student care services (Source) | KML |
| Park Connector Loop | Indicative segments of park connectors (Source) | KML |
| Parks | Polygons of parks manged by NParks (Source) | KML |
| Play & Fitness Equipment | Location of play and fitness equipment managed by NParks (Source) | KML |
| NParks Activity Area | Location of NParks managed activity areas (Source) | KML |
| Community Club | Location of community clubs (Source) | KML |
| Community in Bloom | Location of community gardens (Source) | KML |
| Community Use Sites | Location of community sites managed by SLA and HDB (Source) | KML |
| Sports Facility | Location of sports facilities (Source 1, Source 2, Source 3) | KML |
Challenges and Mitigation
| Challenge | Mitigation |
|---|---|
| Data Cleaning and Geospatial Wrangling | Data may be noisy or unclean, and raw data are not always in an appropriate format for analysis. It is therefore essential to take documented steps to clean and process data, and to conduct regular data sanity checks. |
| Lack of research on relationship between built spaces and child development in Singapore | In the absence of such research, we will be relying on research from other countries as reference for our project that is in the context of Singapore. For future work, as such research become more available, we may be able to finetune and more specifically fit the analysis to the local context. |
| Inexperience with R Shiny | As this is a new package that we are exploring, it will be a challenge to utilise its full abilities. To overcome this challenge, we will have to regularly consult documentation and conduct regular testing to ensure our application is working appropriately. |
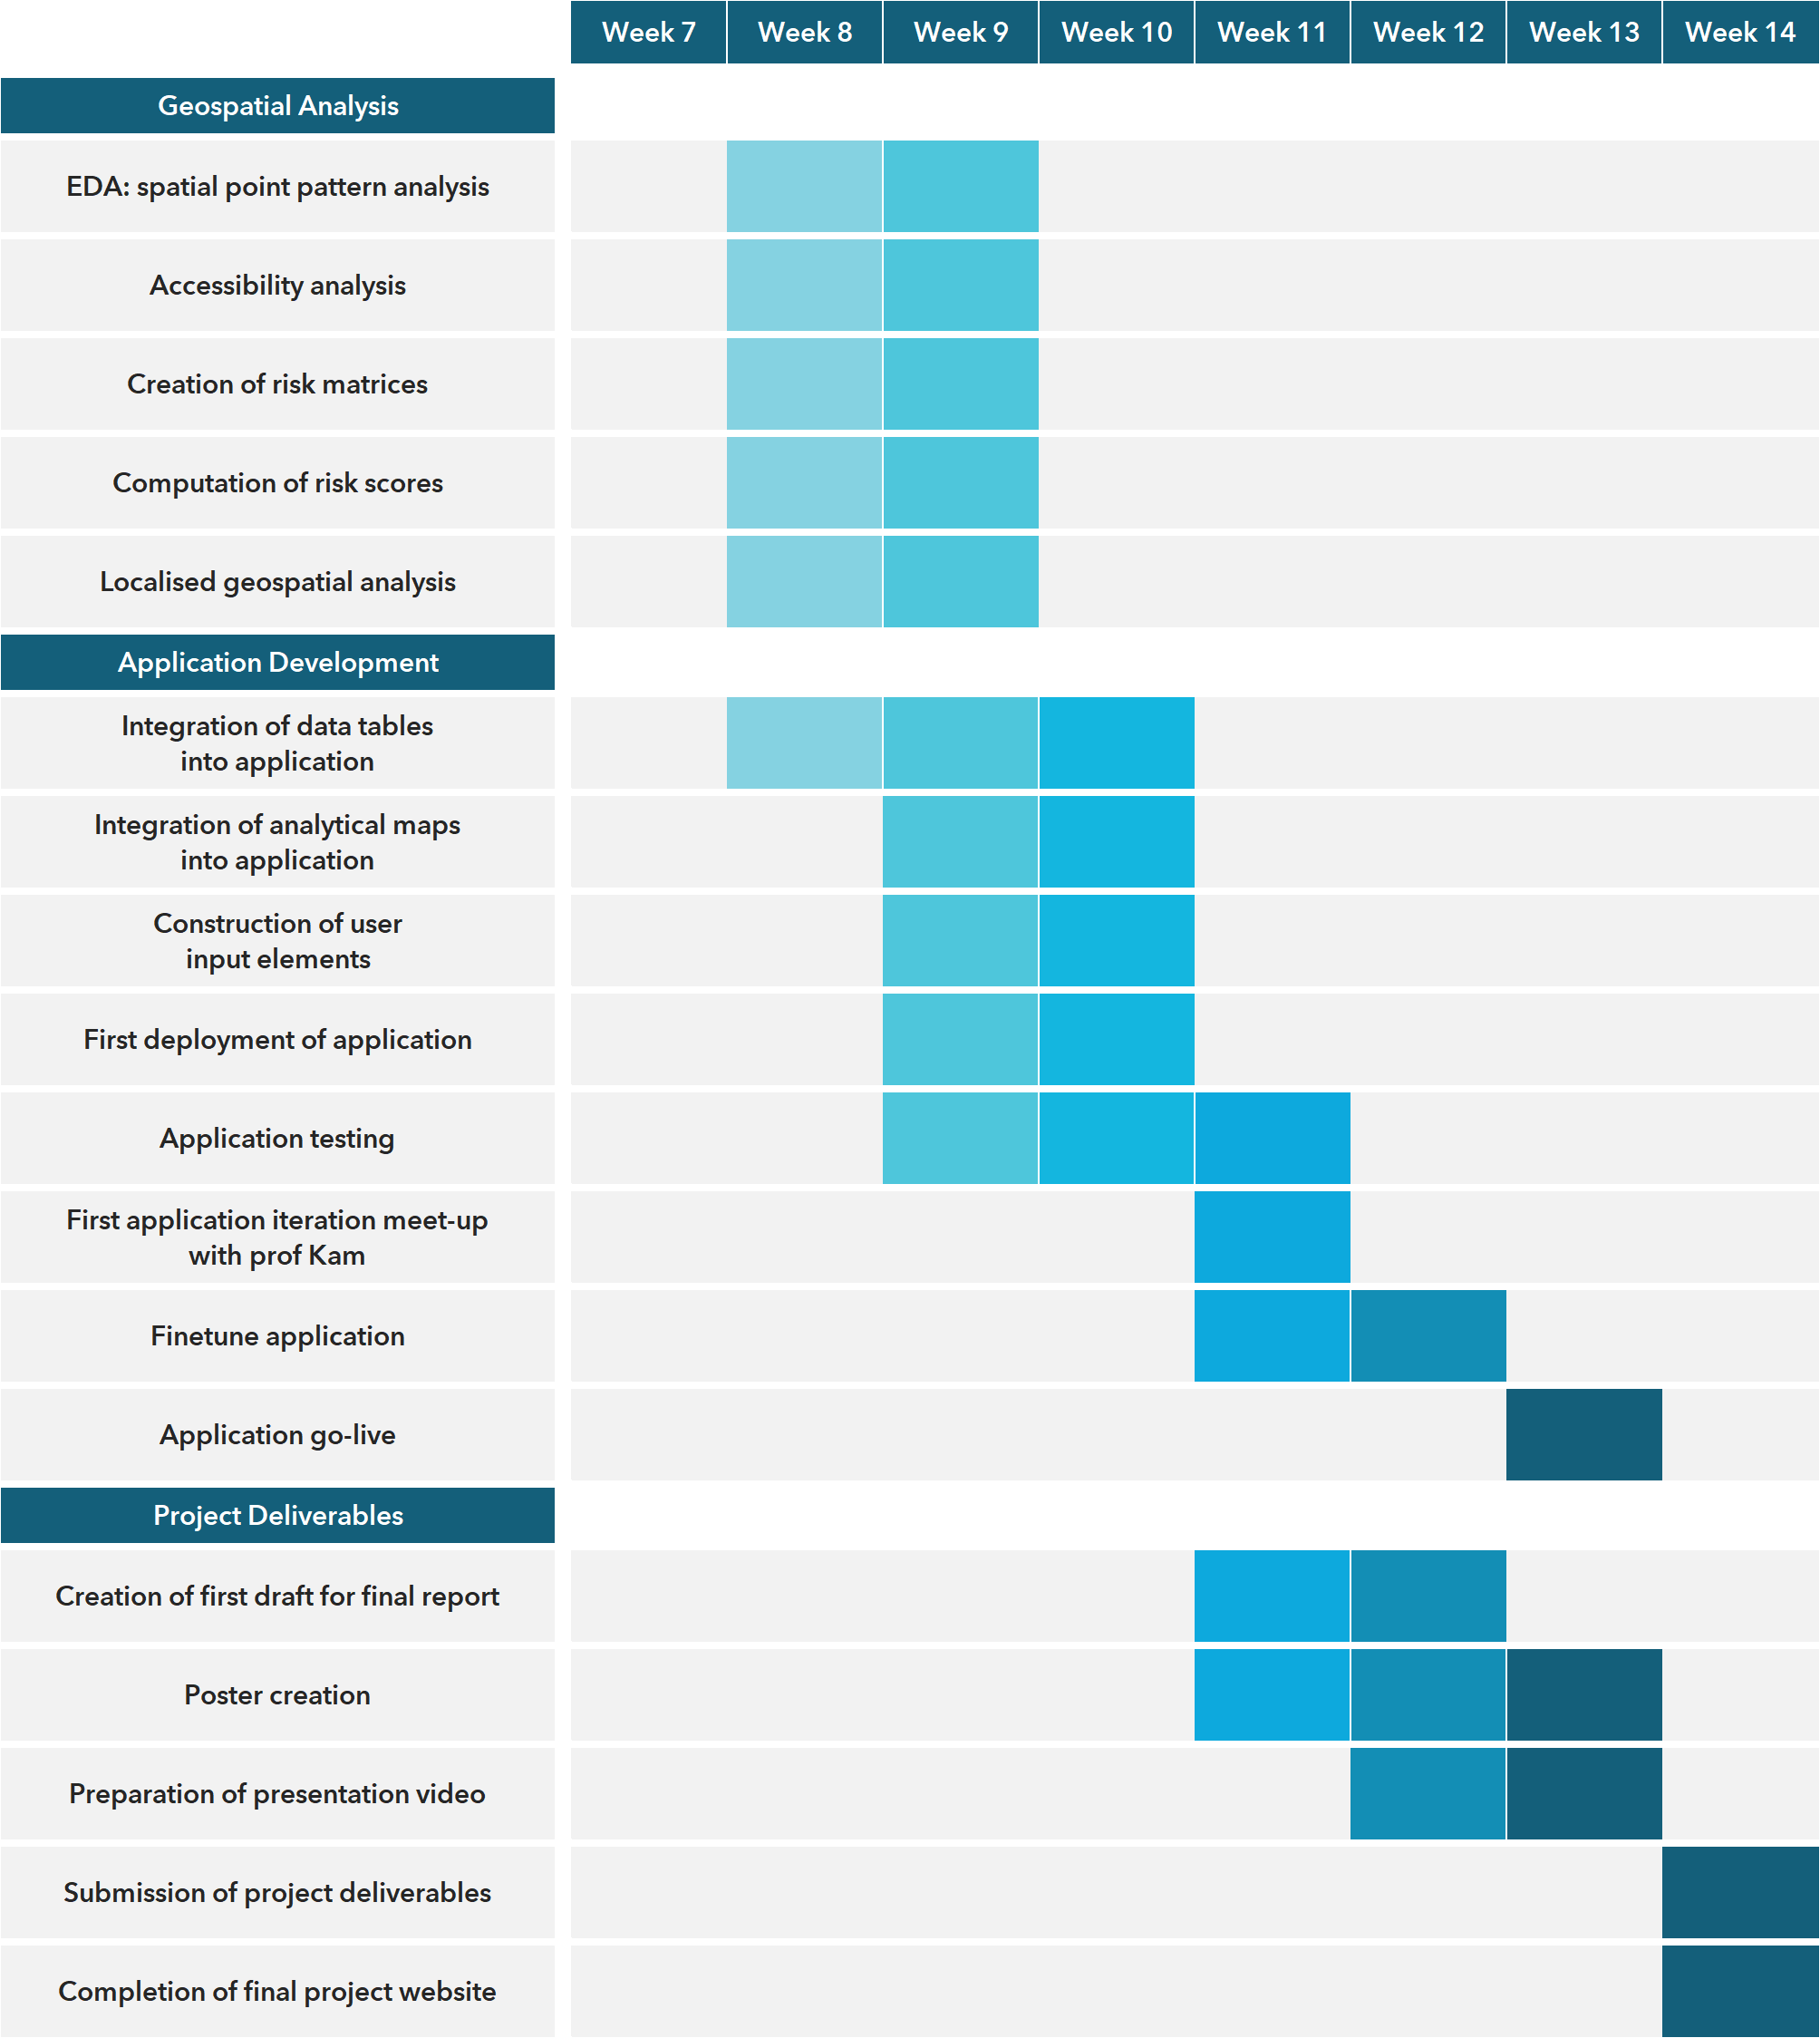
Scope of Work
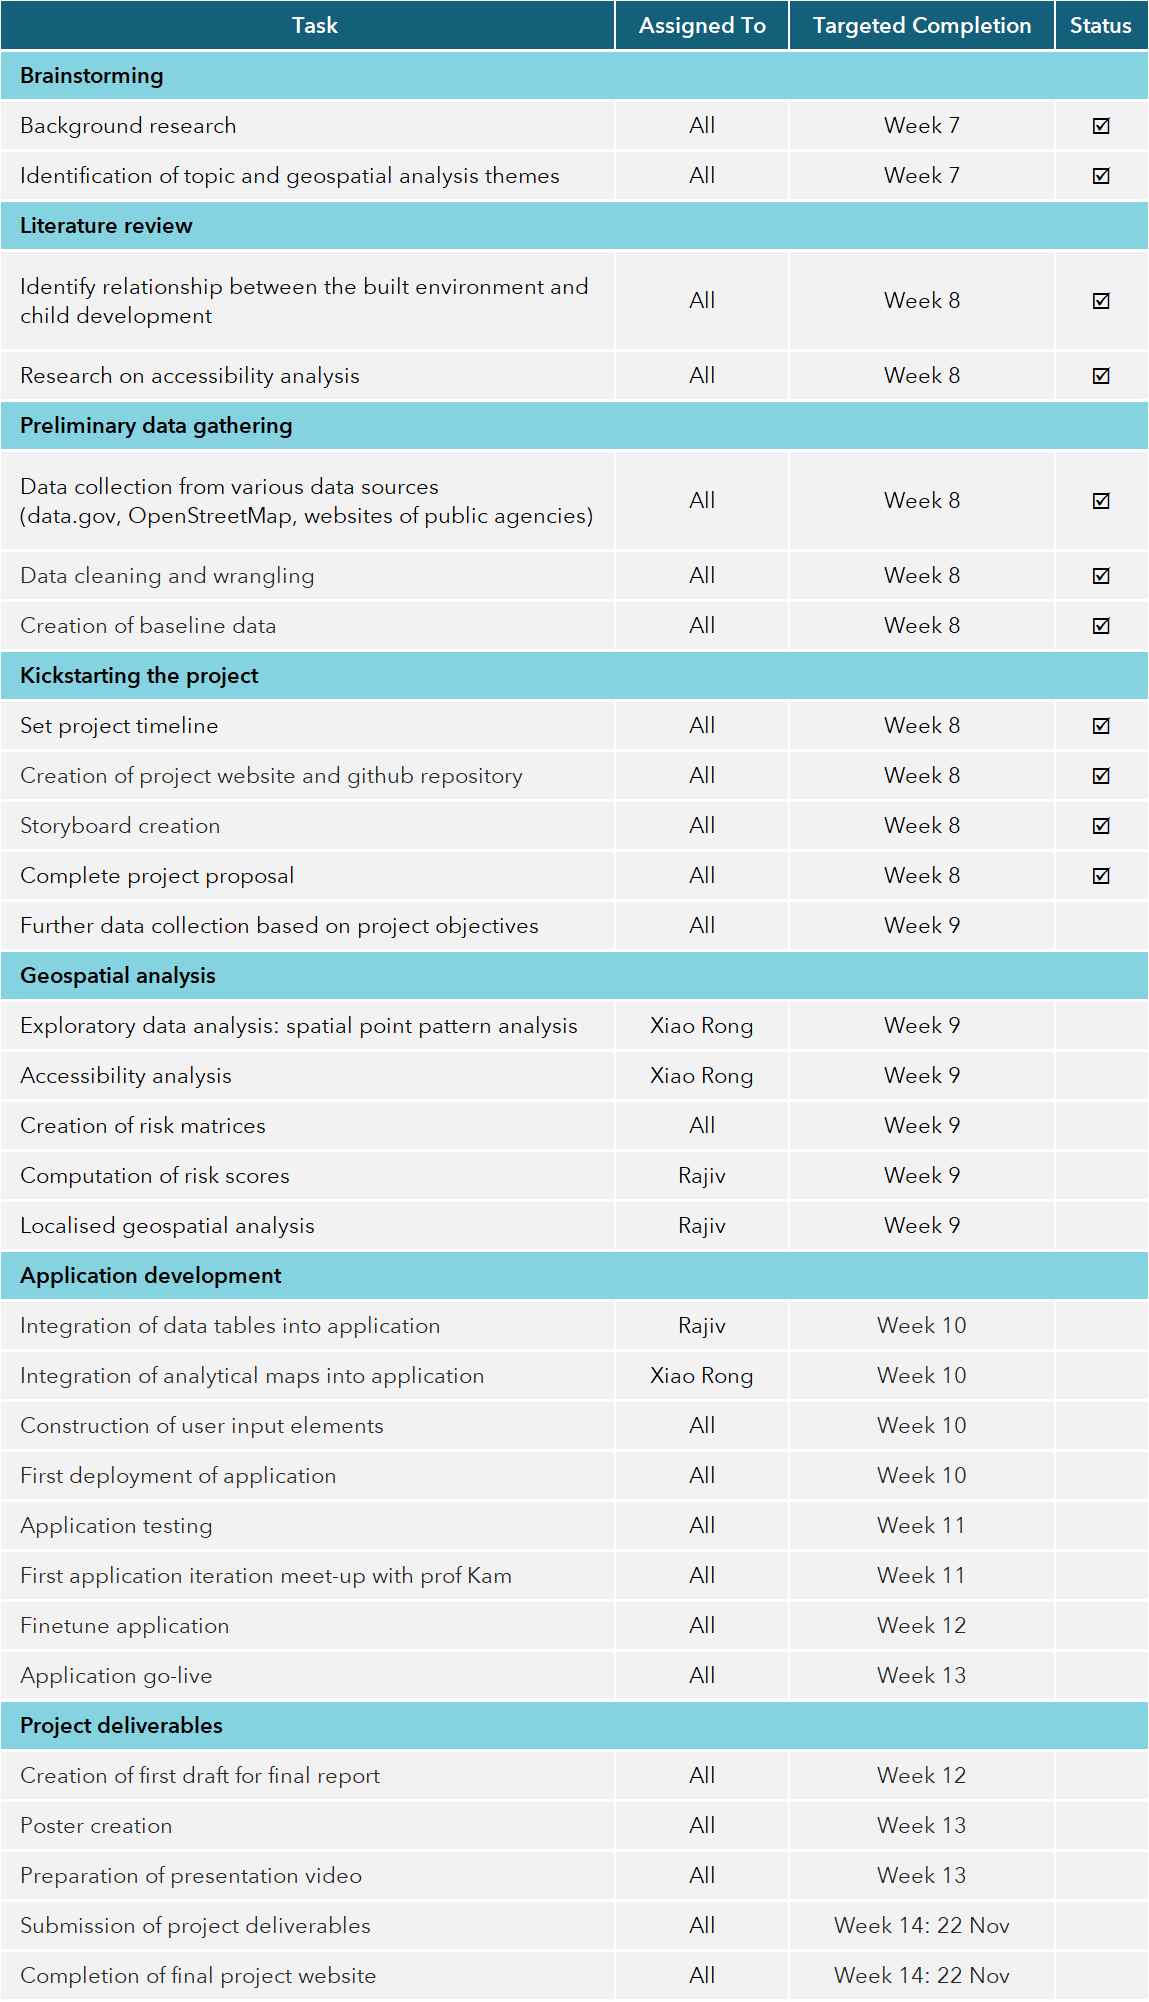
The gantt chart below outlines the scope of work and timeline that will be undertaken in this project.

Task Completion List
The table below tracks task completion for the project.